You are currently browsing the tag archive for the ‘strike’ tag.
The Bull Put Spread is set up by buying a LOWER strike Put while simultaneously selling a HIGHER strike Put, both with the SAME expiration date. This trade is also known as a Vertical Spread, because the expiration months are the SAME. The Bull Put Spread is a Credit Spread, meaning you will receive a higher price for the Put that you sell than you wil pay for the Put that you purchase.
In order to enter this position the investor will have some beliefs.
1) She believes that the underlying security will stay the same or go up. Depending on the strikes chosen, the underlying security can even go down a little and this position will still make money. That is why this position has the word Bull in the name, it has a bullish bias.
2) The investor understands that IF the underlying stock moves counter to the postion, in this case, down, the position can lose 100% of the money at risk. The good thing about a vertical spread, however, is that the options WILL retain some value, up until, expiration. This means that a 100% loss can be avoided.
Lets look at an example:
In a recent Trading Idea I said to buy a July 2009 $12 Put while selling a July 2009 $13 Put on SLV (IShares Silver ETF). Here is the Risk/Reward graph for this position.
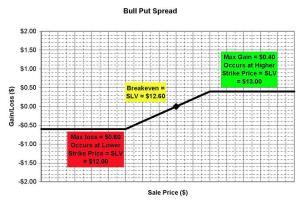
The Maximum Loss is $0.60 ($1.00 difference in stikes – $.040 premium), and this will occur if SLV is trading below $12 at expiration, July 18, 2009.
The Maximum Gain is $0.40 (Premium recieved for position), and this will occur if SRS is trading above $13 at expiration, April 18, 2009.
The breakeven is if SLV is trading at $12.60 at expiration, July 18,2009. The breakeven for this postition can be calculated by taking the strike price for the option sold (the $13 Put) – the premium received ($0.40). If SLV is trading below $12.60, this position will have a loss. If SLV is trading above $12.60 this position will have a gain.
Today SLV is trading for $13.68. This means that SLV can lose 5% ($0.68)between now and July 18th and this position will still have the Maximum Gain. SLV can lose 7.9% ($1.08) in that time frame and this position will Breakeven (not including trading costs). SLV has to lose more than 12% in this time frame to incur the Maximum Loss.
The Bull Call Spread is set up by buying a LOWER strike Call while simultaneously selling a HIGHER strike Call, both with the SAME expiration date. The Bull Call Spread is a Debit Spread, meaning you will pay a higher price for the Call that you purchase than the price of the Call that you sell.
In order to enter this position the investor will have some beliefs.
1) She believes that the underlying security will stay the same or go up. Depending on the strikes chosen, the underlying security can go down a little and this position will still make money. That is why this position has the word Bull in the name, it has a bullish bias.
2) The investor understands that IF the underlying stock moves counter to the postion, in this case, down, the position can lose 100% of the money invested. The good thing about a vertical spread, however, is that the options WILL retain some value, up until, expiration. This means that a 100% loss can be avoided.
Lets look at an example:
In a previous Trade Idea I suggested a Vertical Spread. I said to buy a July 2009 $35 Call while selling a July 2009 $55 Call on SRS (Proshares Ultrashort Real Estate Fund). Here is the Risk/Reward graph for this position.
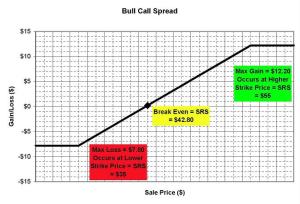
The Maximum Loss is $7.80 (+ Trading Costs), and this will occur if SRS is below $35 at the expiration, July 18, 2009.
The Maximum Gain is $12.20 ($20-$7.80) (- Trading Costs), and this will occur if SRS is above $55 at the expiration, July 18, 2009.
If SRS is between $35 and $55 at expiration, July 18, 2009, then the gain/loss will be -$7.80 (the cost of the spread) – $35 (the price that you can buy (call) SRS) + the price of SRS. Therefore the breakeven point for this position is $42.80 (-$7.80 – $35 + $42.80 = $0) (not including trading costs).
This trade was entered when SRS was trading for $59.44. This means that if SRS stays the same or goes up OR goes down $4.44 (7.5%) this position will still make the maximum gain. SRS has to drop to $42.80, a loss of $16.64 (or 28%), for this position to start to lose money. The 52 week low for this ETF is $48.00.
This position cost us $7.80/share and has an upside potential profit of $12.20/share. That would be a 256% gain in approximately 6 months. Which is an approximate 500% APR (Annual Percentage Rate).
One other note on this example: This position is called a Bull Call Spread, that means that I was “bullish” on SRS. However, SRS is an “Ultrashort” ETF, which means that it moves up when some index, in this case the real estate fund, goes down. In essence, this position was a “bearish” position. I hope I have not confused the situation.
If you buy a PUT option on that stock, you have the right to sell that stock at a certain price by a certain date. You do not have an obligation to sell the stock, it is your choice. There are a few variables that go into the price of the put option the same as a CALL option. The main variables are the Strike Price, the Expiration Date and the Price of the Stock.
Lets look at Intel Corporation (INTC) as an example. On February 23, 2009 INTC closed at $12.07Bid/$12.10Ask. The following is a list of near the money Call options that expire in March 2009.
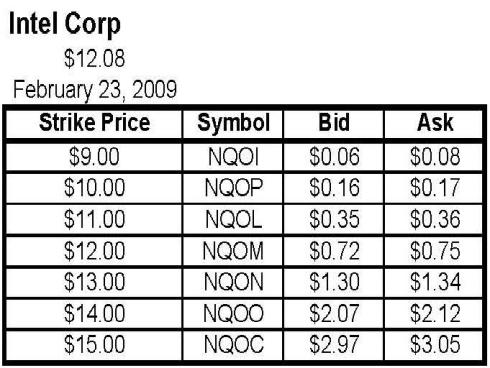
Put Options - Intel February 23, 2009
If you purchased one March $12 Put (symbol NQOM) for $0.75 (plus transaction costs) today, you would have until the March 20th (the third friday of March) Expiration date to EXERCISE the option. If you exercise the option, you would give your broker 100 shares of Intel (INTC) and your broker would pay you $12/share (plus transaction costs).
Why would you do this?
Perhaps you think INTC is going to announce something that will make the stock FALL between now and when the option expires. If you think the stock is going to fall, then you can do a few things. The first would be to SHORT the stock (see earlier posts) or you could purchase a PUT. (There are other things as well that I will discuss later)
If INTC makes an announcement and the stock falls to $10.00/share, you will have a gain of $2.00/share less what you paid for the option ($0.75), for a total gain of $1.25/share (less transaction costs). If INTC stays above $12.00 you will not exercise the option and it will expire worthless, for a maximum loss of $0.75. If INTC falls to $11.25, you will break even (not including transaction costs). If you had shorted the stock, and it rises to $13.00, you would have lost $1.00, and it could go higher.
Lets look at the risk/reward graph, at the expiration date.
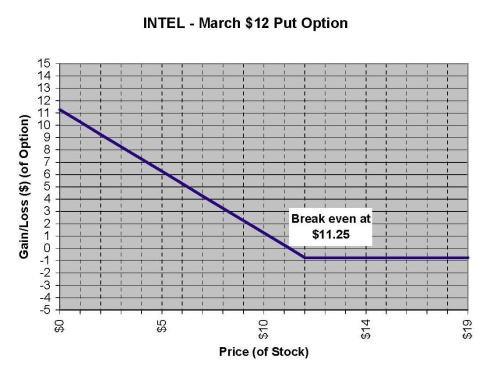
$12 March 2009 INTEL Put
If INTC stock is below $11.25 (less transaction costs) the options will produce a gain. If INTC stock is above $12, the options will expire worthless, and the maximum loss of $0.75 will be realized. In between $11.25 and $12.00 the options will incur some gain.
If we compare the graph for being SHORT (selling) a stock vs. buying a Put, one can see that we have limited the downside, while maintaining an unlimited upside potential (Not necessarily unlimited as the price of a stock can only go down to $0), by buying a Put.
CONS: The put option has a time limit. If we purchased the $12 put (symbol NQOM) for $0.75 and the stock were to stay above to $12.00 the put will expire worthless and we will lose $0.75 at expiration.
Do not be disappointed yet, remember, I am trying to explain the basics before I explain more complex combinations.
To be continued—

Comments