You are currently browsing the tag archive for the ‘risk return graph’ tag.
If someone buys a stock, they are long the stock. People do this, with the intention of selling it later for a profit (or collecting dividends, while they own it).
If you have the correct account with a broker and have the required margin, you can also sell the stock first. This is called being SHORT the stock or shorting a stock. People do this with the intention of buying it back later at a lower price for a profit. If someone wants to short a stock, they are supposed to borrow the stock from somewhere and then sell it (the broker will take care of this). Then if the stock price goes down, they can buy it for less, making a profit. If, however, the stock price rises, they will incur a loss when they purchase it at a higher price than they sold it. In the recent past, there are the indications that the regulators have allowed people to just sell stock short, without borrowing it first. This distorts the market.
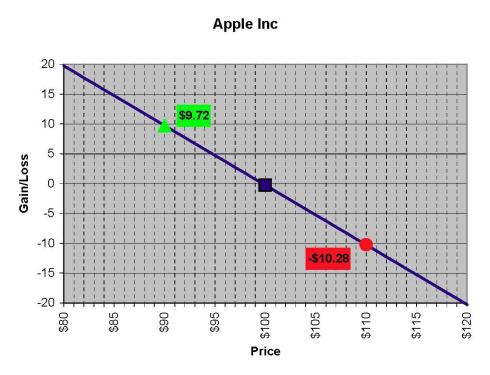
Let’s use the same Apple stock from February 6th to illustrate an example. The following graph shows the risk/reward for shorting a stock.

Apple as of February 6, 2009
As you can see, at any price lower than the purchase price of $99.72 (the closing price on February 6, 2009), you will have a gain. At any price above $99.72, you will have incur a loss, and at $99.72 this will be an even trade.
Notice that this is exactly opposite owning the stock, or being long. The risk/reward graphs that I will continue to use, will be very similar. They will show the risk/reward for any position, and if you “mirror” the graph around the $0 line (the x-axis in my graphs) they will show the risk/reward for the opposite position.
Please also notice that these two positions (being long or short a stock) have a possible unlimited gain and a possible unlimited loss outcomes. Proper use of options will allow us to limit these (especially the losses). For clarification, I say that owning a stock has a possible unlimited loss outcome, but in reality the stock can ONLY go to $0 (everyone remember Enron). So really the most someone can lose when they buy a stock, is the purchase price. Also, the maximum gain for being short a stock will occur if the stock goes to $0.
I have simplified this example, please remember that some stocks will have a dividend, stock splits, etc. that will affect this calculation. For example, if you were to receive a dividend, it could be argued that this reduces your cost. Please also remember that time value can be a factor in the calculation.
When I own an asset, it is also known as being LONG an asset. If I buy a stock, I am long the stock. Assets can take many forms, a few examples are stocks, bonds, real estate, commodities, automobiles, etc.
When you purchase an asset, there are three possibilities that can happen in the future.
1. The asset can appreciate, meaning you will be able to sell it for more than you purchased it. This will result in a gain, and depending on the type of account it is held in, you may owe taxes on the gain. These are the assets that we want to own.
2. The asset can retain its value, it neither appreciates nor depreciates. You will be able to sell this asset in the future for the same amount that you paid for it.
3. The asset can depreciate, meaning that when you sell it in the future, you will sell it for less than what you paid for it. This will result in a loss, and depending on the type of account it is is held in, you may have a loss to claim on taxes. Who would purchase an asset that depreciates? Every adult that I know owns at least one depreciating asset……their car.
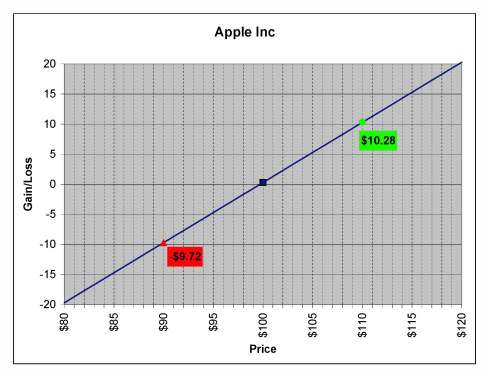
This is a risk/return graph for the owning an asset, I will use Apple on February 6, 2009 for this example.

Apple as of Februart 6, 2009
As you can see, at any price lower than the purchase price of $99.72 (the closing price on February 6, 2009), you will incur a loss. At any price above $99.72, you will have a gain, and at $99.72 this will be an even trade.
I have simplified this example, please remember that some stocks will have a dividend, stock splits, etc. that will affect this calculation. For example, if you were to receive a dividend, it could be argued that this reduces your cost. Please also remember that time value can be a factor in the calculation.


Comments